- Previous message: Ruurd A Reitsma: "XForms: xforms and cygwin 1.1"
- Maybe in reply to: justin.turnage@lmco.com: "XForms: XY Plot weirdness"
- Next in thread: Steve Lamont: "RE: XForms: XY Plot weirdness"
- Messages sorted by: [ date ] [ thread ] [ subject ] [ author ]
> # To subscribers of the xforms list from Steve Lamont <spl@ncmir.ucsd.edu>
> :
>
> > ...
> One
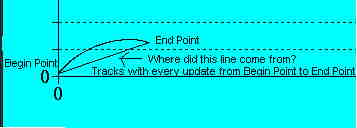
> > form plots the data perfectly real-time. The other form plots the data
> > perfectly as well but has this trailing straight line that starts at the
> > begin point and follows the end point precisely while the data is
> plotting
> > real-time. I can't seem to find anything in the documentation that
> explains
> > this behavior. Can anyone help?
>
> Are you sure it's not an off by one error of some kind?
>
I dont think the off by one error is an issue. My program just
grabs the data out of a shared memory block and displays the data on the
xyplot object.
Here is how I set the plot up in one module:
fdui->FIRST_PLOT = obj =
fl_add_xyplot(FL_NORMAL_XYPLOT,1,40,1261,432,"Plot #1");
fl_set_object_dblbuffer(obj,1);
fl_set_xyplot_data(obj,&X,&Y,1,"","");
fl_set_xyplot_xbounds(obj,0.0,2500.0);
fl_set_xyplot_ybounds(obj,0.0,700.0);
fl_set_object_boxtype(obj,FL_DOWN_BOX);
fl_set_object_color(obj,FL_CYAN,FL_BLACK);
fl_set_object_lsize(obj,FL_MEDIUM_SIZE);
fl_set_object_lstyle(obj,FL_TIMES_STYLE);
fl_set_xyplot_xtics(obj, 5, 1);
fl_set_xyplot_ytics(obj, 5, 1);
fl_set_xyplot_xgrid(obj, FL_GRID_MAJOR);
fl_set_xyplot_ygrid(obj, FL_GRID_MAJOR);
And here is how I update it in the callback procedure:
fl_insert_xyplot_data(fd_MAIN_PLOT->FIRST_PLOT,1,idata,X,Y);
idata++
The second plot is set up simularly to the first plot with some
minor changes.
Here is a snapshot of what I am seeing:
<<Wierd.jpg>>
I use the fl_set_xyplot_data function to initialize the plot and
then I use the fl_insert_xyplot_data to update the plot as fast as the
machine can do the callback.
Here is the system info:
OS: True64 UNIX Version 4.0f
Xforms (as reported by -flversion):
FORMS Library Beta 0.89 of 1999/07/17 03:17:52 (Compiled Oct 2 1999)
Copyright (c) 1996-1999 by T.C. Zhao and Mark Overmars
Thanks for your help!
 _________________________________________________
To unsubscribe, send the message "unsubscribe" to
xforms-request@bob.usuhs.mil or see
http://bob.usuhs.mil/mailserv/xforms.html
XForms Home Page: http://world.std.com/~xforms
List Archive: http://bob.usuhs.mil/mailserv/list-archives/
- Next message: Steve Lamont: "RE: XForms: XY Plot weirdness"
- Previous message: Ruurd A Reitsma: "XForms: xforms and cygwin 1.1"
- Maybe in reply to: justin.turnage@lmco.com: "XForms: XY Plot weirdness"
- Next in thread: Steve Lamont: "RE: XForms: XY Plot weirdness"
- Messages sorted by: [ date ] [ thread ] [ subject ] [ author ]
This archive was generated by hypermail 2b29 : Wed Sep 27 2000 - 11:40:55 EDT